
Data visualization / Web
Glacier Melt
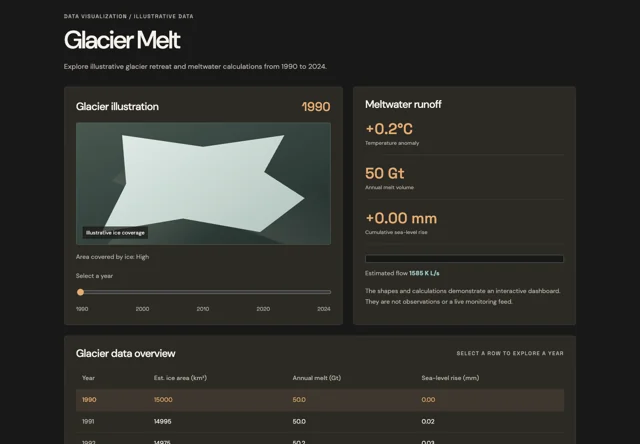
An interactive dashboard exploring illustrative glacier retreat and meltwater data from 1990 to 2024.
What it does
Select a year to explore the glacier illustration, runoff indicators, and data table. The dashboard uses illustrative calculations, rather than live monitoring or actual satellite imagery.
Try the demo
Open Full DemoIllustrative calculations. Explore the interface, or open the full demo in its own tab.
Let’s talk
Have something
in mind?
Have a project in mind, or an opportunity on your team? I’m open to discussing mobile apps, connected systems, and how I can help.